What is a doji?
A doji is a candlestick where the open and the close are at, or very close to, the same price. The body is so thin it looks like a line or a cross. Price may have moved a lot during the period, but by the close it ended roughly where it started. The name comes from a Japanese word meaning “at the same time”.
What does a doji mean?
A doji shows indecision: neither buyers nor sellers won the period. That is why context matters so much. In a quiet, sideways market, dojis are everywhere and mean very little. After a long run up or down, a doji can signal that the side in control is running out of energy, especially if the next candle confirms a turn.
Types of doji
- Standard doji: a tiny body with short wicks of similar length on both sides.
- Long-legged doji: a tiny body with long wicks on both sides. Price swung hard both ways and still ended level.
- Dragonfly doji: open and close at the top, with a long lower wick. Sellers pushed price down and buyers pushed it all the way back.
- Gravestone doji: open and close at the bottom, with a long upper wick. Buyers pushed price up and sellers pushed it all the way back.
- Doji stars: a doji as the middle candle of a three-candle turn: the morning doji star at a low and the evening doji star at a high.
Doji patterns in Chartle
Chartle teaches four doji patterns on real charts. Each page has examples you can practice on.
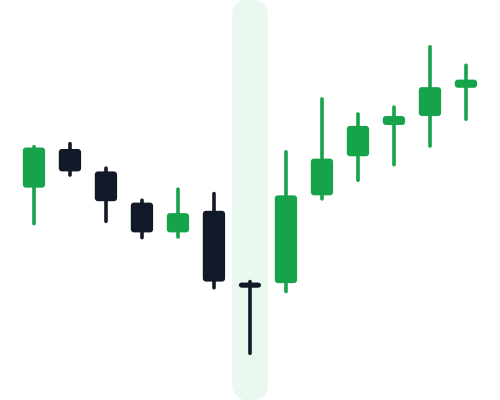 Dragonfly DojiBullish · Candlestick Pattern
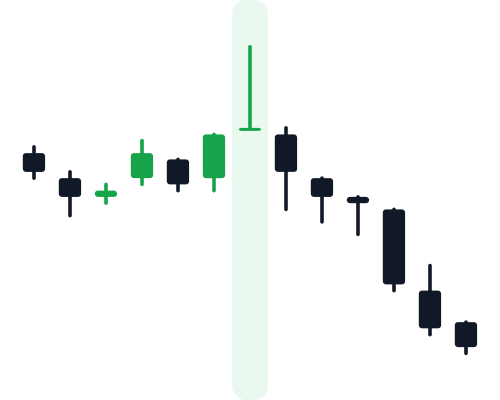 Gravestone DojiBearish · Candlestick Pattern
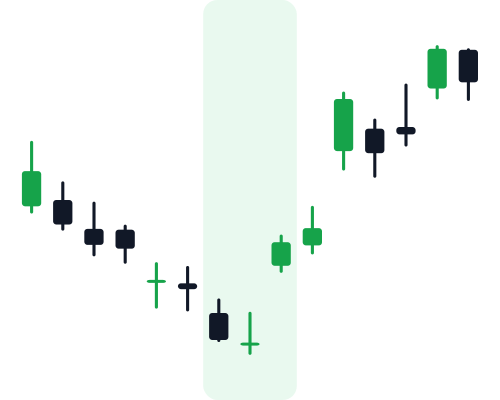 Morning Doji StarBullish · Candlestick Pattern
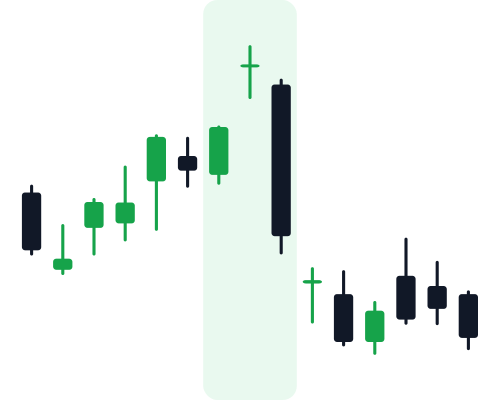 Evening Doji StarBearish · Candlestick Pattern
How to read a doji
- Look at what came before. A doji after a strong trend is worth noticing; one inside a range usually is not.
- Look at where it formed. Near a recent high, a recent low or a level price has turned at before, it carries more weight.
- Wait for the next candle. A doji is a question, not an answer. The candle after it often shows which way the market leaned.
When a doji fails
Often. A doji is common, and most of them are just a pause before the trend carries on. Treat it as a reason to pay closer attention, not as a signal on its own. Learning to tell a meaningful doji from noise is exactly the kind of judgement that practice on real charts builds.
New to candles? Start with how to read candlestick charts, or browse the full candlestick patterns cheat sheet.

